Digital Archaeology
Digital archaeology has been a crucial component of YMAP-South’s work at the site of the women’s monastery at Atripe, with multiple applications, from the recording of architecture and epigraphy to the documentation of excavation stages, and from site mapping to cultural heritage monitoring.
In the last decade, the application of digital technology has become almost fully integrated into the discipline of archaeology.[1] Early digital archaeology at Atripe by the University of Tübingen expedition and Bochum University of Applied Science’s Department of Surveying and Geoinformation included a topographical survey and terrestrial laser scanning.[2] A further laser-scanning survey of the temple as it appeared post-excavation was completed by the University of Tübingen expedition and Bonn Center for Digital Humanities in 2019.[3]
Digital archaeology, undertaken by Alberto Urcia in 2016–2019, has been an integral part of the Yale Monastic Archaeology Project’s (YMAP-South) work at the women’s monastery at Atripe, operating alongside and in cooperation with manual techniques. Topographic mapping and Structure from Motion (SfM) have been used effectively in many aspects of YMAP’s work, using a multi-scale approach to manage the recording of architecture, the progress of excavation, and epigraphic finds.[4]
The purposes of the topographic mapping methods employed were to locate the site globally via a standard mapping system, to integrate information from previous archaeological work, and to visualize and investigate the relationship between the monastery and its physical setting. The creation of a photorealistic three-dimensional (3D) model of the Repit temple, showing the monastic adaptive reuse of this structure and purpose-built additions to its periphery, provided a digital record of the monastic built environment (fig. 1) and a tool for its off-site investigation. The correlated dataset of 3D information resulting from this work is a rich resource for further study and for the multi-platform presentation of results.
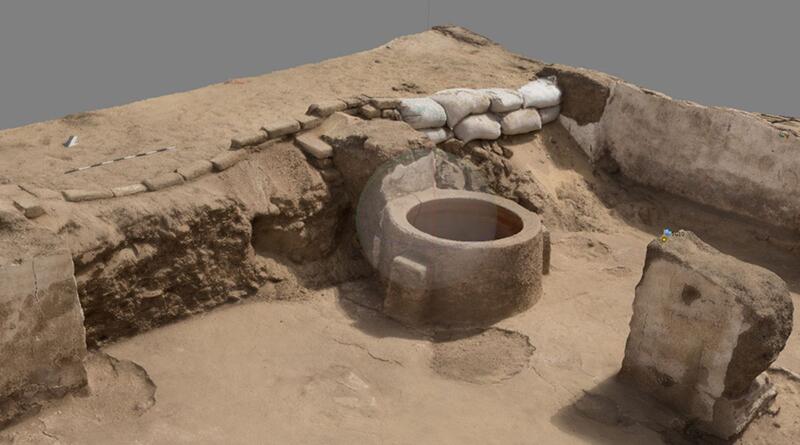
Figure 1. Screenshot from Agisoft Metashape showing the 3D textured model of part of the Six-Pillared Hall excavated in 2016. The lighter-coloured circle in the centre is the track-ball, a visualizing tool that is part of the program interface.
A flexible multi-scale approach combining digital imaging (photogrammetry) and topographic surveying was developed by Alberto Urcia (fig. 2). Structure from Motion (SfM) was chosen as the main technique to produce 3D data from two-dimensional (2D) images.[5] Its workflow (or pipeline), from the photographing phase to the production of final models, makes it a powerful and adaptable tool for data processing. Urcia customized the data acquisition and its post-processing, taking account of the diversity of research questions that might be applied to the 3D-model. A further consideration was the workflow constraints of short episodic fieldwork seasons, during which outputs of different types would be required for other specialists. The temple and its environs were divided into discrete areas for data acquisition and initial modelling, focusing on those from which ortho-images of walls and floors would be needed during the course of the current season. Final processing of all data into a single photorealistic model has yet to be completed.
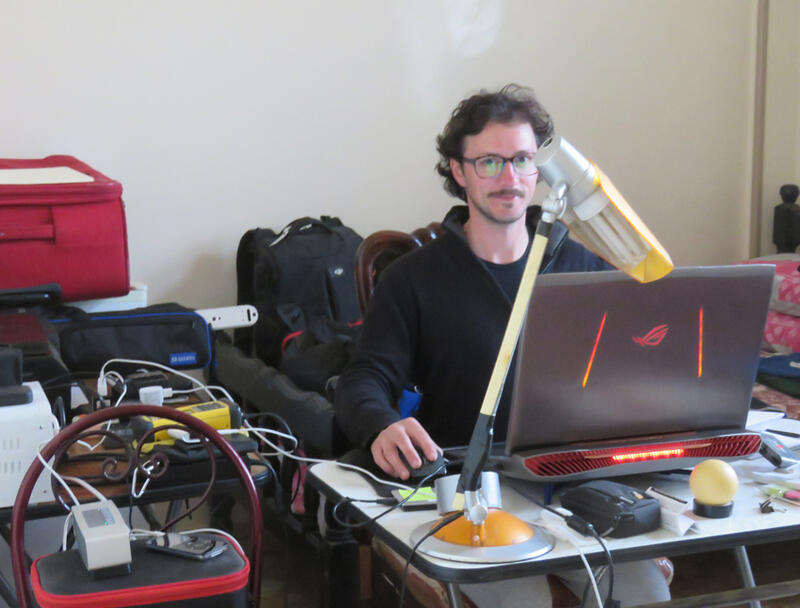
Figure 2. Alberto Urcia processing data during the 2017 season.
Topographical mapping began before the acquisition of any on-site data, using satellite imagery to establish a base-map. This base-map needed to locate the site within a global co-ordinate system based on the World Geodetic System (WGS84)—also the global reference frame for GPS navigation—and to be at a resolution high enough for archaeological features to be clearly visible.
Free images from the Environmental Systems Research Institute (ESRI) Satellite Imagery Dataset were used in ArcGIS, a geographic information system (GIS) for working with maps and geographic information.[6] The ESRI imagery was selected for its geo-rectification accuracy.
The low resolution of the free ESRI images was resolved by adding higher resolution GeoEye images available on Google Earth in ArcGIS.[7] By navigating along the timeline, sufficient resolution was found in the archive (in this case images from March 16, 2013) for clear visualization of the temple’s architecture. The 36 screenshots taken all over the study area were blended using Adobe Photoshop to create a new single image that could then be accurately geo-rectified on ArcMap to produce a reliable overlay (fig. 3) onto the ESRI images. This overlay was saved as the high-resolution base map, which included embedded metrical information that allowed the map to be used without having to redo the geo-rectification.
Figure 3 Comparison of the resolution of ESRI (left) and GeoEye (right) images of the Repit temple.
It was then possible to extract several coordinates from visible points and re-position the University of Tübingen CAD topographic survey, which was not geo-rectified but instead used a relative local coordinate system. The coordinates of the site benchmarks, or permanent Ground Control Points (GCPs), could then be established within a standard mapping system and, once on-site work began, accurately reconciled with the 3D model points from the photogrammetry.
Throughout YMAP-South’s work, GIS has been used to integrate other types of geo-spatial information, including locations of modern features (fig. 4) and outputs from previous archaeological work, into the digital record of the site. Outputs from future work, such as geophysical survey results, can be added as these become available through publication.[8] Through periodic updating of the Remote Sensing data (i.e. Google Earth and ERSI base map datasets), GIS may also be used as a technique for cultural heritage monitoring of the archaeological remains.[9]
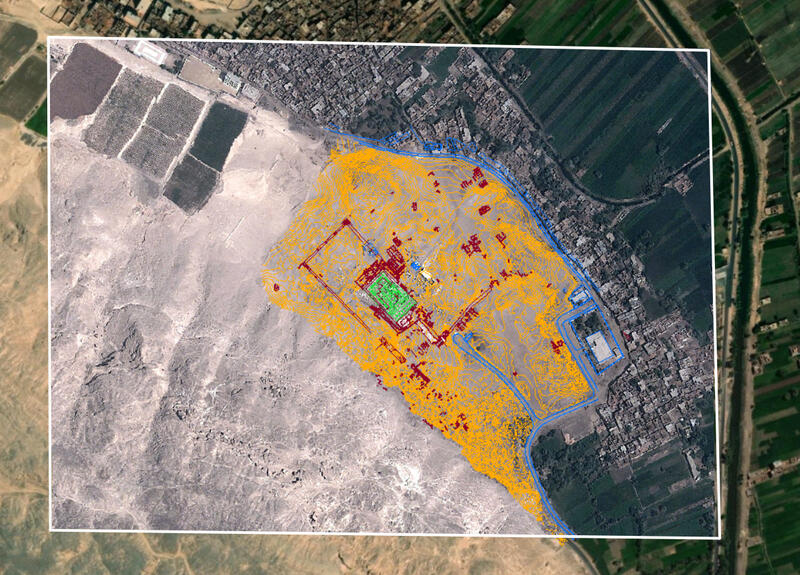
Figure 4. Screenshot from ArcGIS showing the high-resolution mosaic (white rectangle) and the topographic data. These comprise the Repit temple (green), other identified archaeological features (red), modern features (blue), and contour lines (yellow) overlaying the ESRI base map.
Image acquisition (fig. 5) for the 3D model employed a full frame DSLR Camera (Canon 5D Mark III), hand-held or mounted on a telescopic monopod and controlled by a smartphone via a WiFi tethering system (CamRanger). The use of unmanned aerial vehicles (AUVs, also known as drones) is not permitted in Egypt. A pre-established work-scheme ensured full photographic coverage with ample overlap, allowing the software to automatically match the same feature within multiple images and calculate the 3D geometry. Raw images were edited employing several products (i.e. Adobe Bridge, Lightroom, and Photoshop) from the Adobe Creative Cloud to correct lighting and color, for editing, and to prepare them for SfM processing.
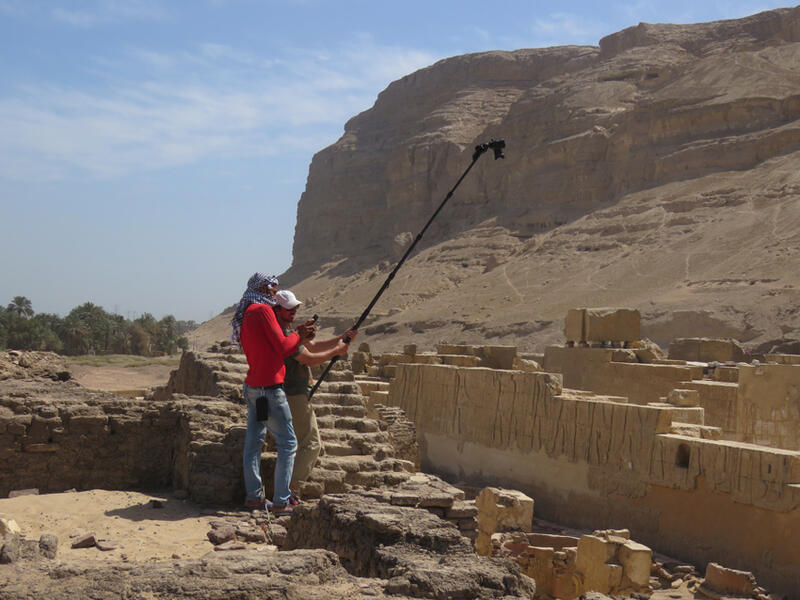
Figure 5. Image acquisition above the Refectory (visible lower right) by Alberto Urcia and Rafaat Hanna Shaker in 2018. They are standing on the enclosure wall, and the temple is on the right.
Geospatial measurements were also needed to control the metrical accuracy of each model and to facilitate its scaling, alignment, and positioning in real-world space. A series of hand-made low-tack targets made of brightly colored modeling putty (Play-Doh plasticine) or plastic bottle tops secured with nails for deposits, were placed on surfaces throughout each area. These were measured with a Topcon GPT Total Station operated with a Bluetooth remote control (Nomad TDS). Each measurement session also included at least three of the permanent Ground Control Points (GCPs), the global positions of which were known, previously established across the site. The calculation and processing of the 3D coordinate (XYZ) of each target using Geopro Meridiana and Autodesk AutoCAD allowed the correct alignment of the point cloud from the image data with the GCPs and the positioning of the model within the global system.
All data was processed using an ASUS ROG laptop workstation with i7 Pro QuadCore, 48 GB RAM and NVIDIA Geforce GTX 980m graphic card. Agisoft Metashape (formerly Agisoft Photoscan) was employed to create the 3D model. The program used algorithms to extract the point cloud, create the 3D meshes, and texturize them from the images (fig. 6).
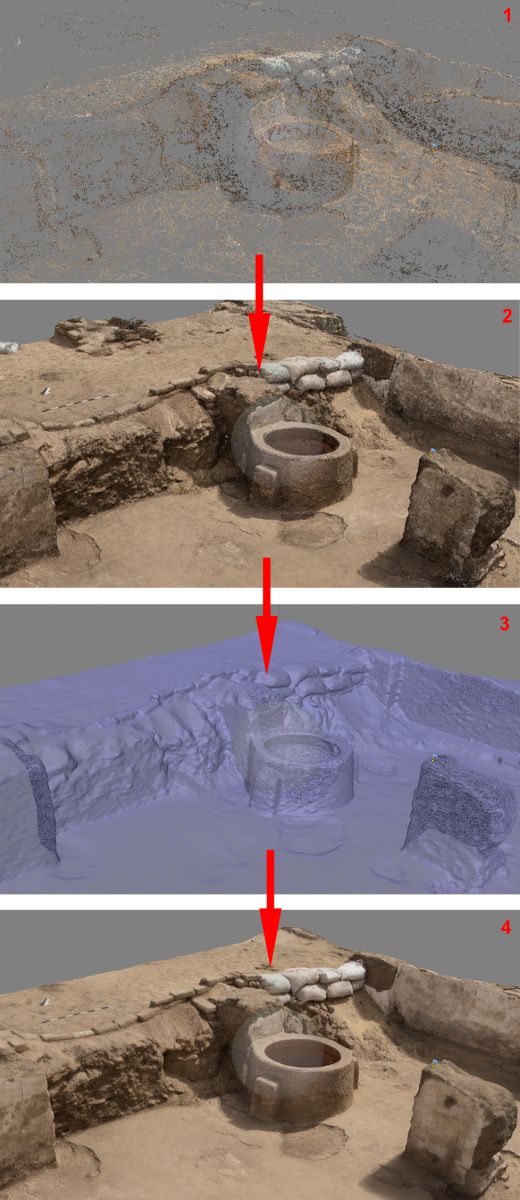
Figure 6. Structure from Motion workflow. 1. Sparse point cloud; 2. Dense point cloud; 3. Neutral mesh; 4. Texturized mesh.
Advanced editing of the 3D model, vectorization, and integration of geospatial data were performed via McNeel Rhinoceros 6.0, a computer-aided design (CAD) program able to manipulate large 3D files and produce image outputs publishable on multiple platforms. The process of vectorization changes simple image data (i.e. dots of a bitmap), which cannot be altered, into coordinate points connected to form lines or shapes (i.e. vectors), the attributes of which may be modified. An example of a common use of vector graphics is in drawing programs such as Adobe Illustrator.[10] An advantage of CAD platforms with 3D data is that they facilitate the manipulation of objects on a vertical (i.e. XZ) plane, such as wall or column faces and associated surfaces decoration or writings. This is particularly useful for producing the scaled 2D ortho-images used as guide for the manual production of excavation drawings and as a tool archaeological recording (fig. 7).
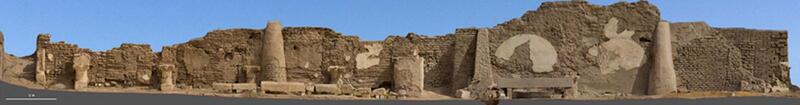
Figure 7. Ortho-image of the east wall of the Refectory, used by Gillian Pyke in her archaeological recording of this space and by Stephen Davis in his epigraphic survey.
The 3D modeling is still in progress, but when completed it will be a photo-realistic record of Atripe and a digital repository of images (i.e. qualitative data) and measurements (i.e. quantitative data). It has already been used to create a variety of 2D images—such as plans, wall-elevations and cross-sections—for use in the field and as part of multi-platform outputs, including conference papers, articles, and web pages. One of the most important of these has been the plan view of the Six-Pillared Hall (fig. 8), which was never fully exposed because it was progressively excavated and backfilled over three seasons in order to protect the fragile mud brick architecture. The model will also be an important tool for further, off-site investigation of the adaptive reuse of the Repit temple, especially in terms of spatial relationships that are difficult to visualize from the ground or on paper.
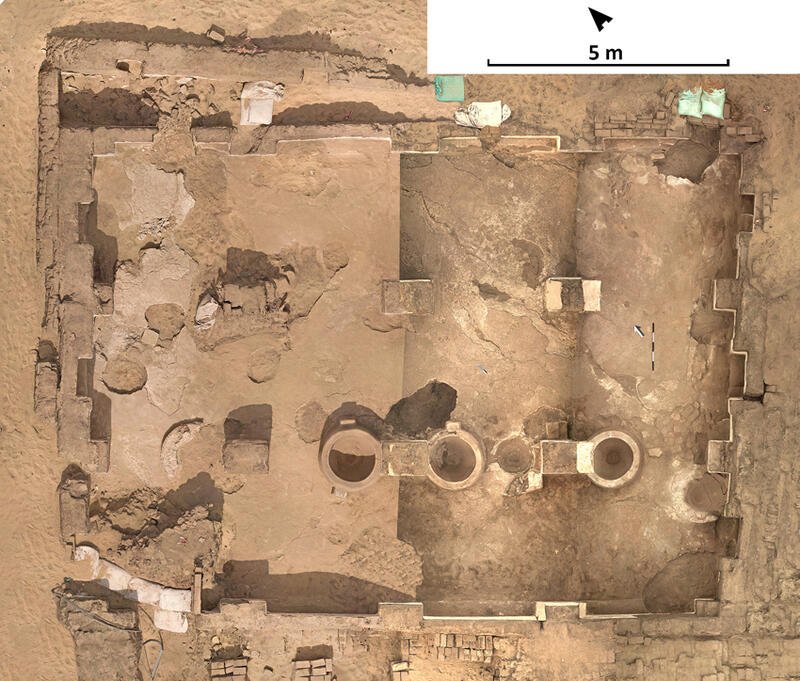
Figure 8. Ortho-image showing plan view of the Six-Pillared Hall as it would have appeared had it been fully exposed.
[1] For an introduction, see B. R. Olson and W. R. Careher, eds., Visions of Substance: 3D Imaging in Mediterranean Archaeology, The Digital Press @ The University of North Nebraska, 2015 (published online), available at https://thedigitalpress.org/portfolio/visions-of-substance-3d-imaging-in-mediterranean-archaeology/; D. Fellner, ed., VAST 2011: Proceedings of the 12th International Conference on Virtual Reality, Archaeology and Cultural Heritage, Prato, Italy, October 18–21, 2011 (Goslar: Eurographics Association, 2011), available at https://dl.acm.org/doi/proceedings/10.5555/2384495; F. Remondino, 3D Recording and Modelling in Archaeology and Cultural Heritage: Theory and Best Practice (Oxford: Archaeopress, 2014).
[2] R. Staiger, H. J. Przbilla, and E. Büttner, “Geodetic Surveying Methods,” in Athribis I, General Site Survey 2003-2007, Archaeological & Conservation Studies. The Gate of Ptolemy IX., Architecture and Inscriptions, ed. R. El-Sayed and Y. El-Masry (Cairo: Institut français d’archéologie orientale, 2012), 97–102, figs. 2.2.3a–2.2.5.
[3] Available at https://www.youtube.com/watch?v=XyybETp9TMM.
[4] See, for example, M. D. Howland, F. Kuester, and T. E. Levy, “Photogrammetry in the Field: Documenting, Recording and Presenting Archaeology,” Mediterranean Archaeology and Archaeometry 14.4 (2014), 101–108; A. Fiorini, A. Urcia, and V. Archetti, “The Digital 3D Survey as Standard Documentation of the Archaeological Stratigraphy,” in VAST 2011, ed. D. Fellner, 145–152, available at https://dl.acm.org/doi/proceedings/10.5555/2384495.
[5] For an introduction to Structure from Motion, see J. L. Carrivick, M. W. Smith, and D. J. Quincey, Structure from Motion in the Geosciences (Hoboken: John Wiley & Sons, 2016); S. Green, A. Bevan, and M. Shapland, “A Comparative Assessment of Structure from Motion Methods for Archaeological Research,” Journal of Archaeological Science 46 (2014), 173–181. For some examples, see M. J. Westoby, J. Brasington, N. F, Glasser, M. J. Hambrey and J. M. Reynolds, “ʽStructure-from-Motion’ Photogrammetry: A Low-Cost, Effective Tool for Geoscience Applications,” Geomorphology 179 (2012), 300–314; J. A. B. López, G. A. Jiménez, M. S. Romero, E. A. García, S. F. Martín, A. L. Medina, and J. A. E. Guerrero, “3D Modelling in Archaeology: The Application of Structure from Motion Methods to the Study of the Megalithic Necropolis of Panoria (Granada, Spain),” Journal of Archaeological Science Reports 10 (2016), 495–506.
[6] These images are accessible under license by users of ArcGIS. Alternative open access images are available on OpenStreetMap at https://www.openstreetmap.org/#map. For an open source program similar to ArcGIS, see Quantum GIS, available at https://qgis.org/en/site/. For an introduction to GIS, see P. A. Longley, M. F. Goodchild, D. J. Maguire, and D. W. Rhind, Geographic Information Science and Systems, fourth edition (Hoboken: John Wiley & Sons, 2015); I. Heywood, An Introduction to Geographical Information Systems, fourth edition (Upper Saddle River: Prentice Hall, 2011); and A. Scianna and B. Villa, “GIS Applications in Archaeology,” Archeologia e Calcolatori 22 (2011), 337–363, available at http://eprints.bice.rm.cnr.it/4245/.
[7] GeoEye images are available at https://earth.esa.int/eogateway/missions/geoeye-1.
[8] W. M. F. Petrie, Athribis (London 1908), pls. XIV and XXXV; Y. el-Masry, “More Recent Excavations at Athribis in Upper Egypt,” Mitteilungen des Deutschen Archäologischen Instituts Abteilung Kairo 57 (2001), fig. 4; R. El-Sayed and Y. El-Masry, eds., Athribis I, General Site Survey 2003-2007, Archaeological & Conservation Studies, The Gate of Ptolemy IX., Architecture and Inscriptions (Cairo 2012), pls. II-V; M. Abul-Yazid, S. Hammam and S. Abderrahman, “Excavations in the Temple of Repit at Athribis in the 1980s,” in in M. Müller, M. El-Bialy and M. Boriak, eds. Athribis V, Archäologie im Repit-Tempel zu Athribis 2012-2016 (Cairo 2019), figs. 2-6.
[9] For examples of the use of GIS for cultural heritage monitoring in Egypt, see A. Elfadaly, W. Attia, and R. Lasaponara, “Monitoring the Environmental Risks Around Medinet Habu and Ramesseum Temple at West Luxor, Egypt, Using Remote Sensing and GIS Techniques,” Journal of Archaeological Method and Theory 25 (2018), 587–610; R. Lasaponara, A. Elfadaly, and W. Attia, “Low Cost Space Technologies for Operational Change Detection Monitoring Around the Archaeological Area of Esna-Egypt,” in Computational Science and Its applications–ICCSA 2016. Lecture notes in Computational Science, Volume 9787, ed. O. Gervasi, B. Murgante, S. Misra, A. M. A. C. Rocha, C. M. Torre, D. Taniar, B. O. Apduhan, E. Stankova, and S. Wang (Cham: Springer, 2016), 611–621, available at https://doi.org/10.1007/978-3-319-42108-7_48; A. Elfadaly and R. Lasaponara, “On the Use of Satellite Imagery and GIS Tools to Detect and Characterize the Urbanization Around Heritage Sites: The Case Studies of the Catacombs of Mustafa Kamel in Alexandria, Egypt and the Aragonese Castle in Baia, Italy,” Sustainability 11.7 (2019), available at https://doi.org/10.3390/su11072110; E. A. Zaghloul, M. M. Abdeen, S. F. Elbeih, and M. A. Soliman, “Water Logging Problems in Egypt’s Deserts: Case Study Abu Mena Archaeological Site Using Geospatial Techniques,” The Egyptian Journal of Remote Sensing and Space Science 23.3 (2020), 387–399, available at https://doi.org/10.1016/j.ejrs.2020.06.003.
[10] For further information about vectorization, see the GIS section of the Archaelogical Data Service/Digital Antiquity Guide to Good Practice, available at https://guides.archaeologydataservice.ac.uk/g2gp/Gis_2-1 and the Raster and Vector page of Adobe support for Photoshop Elements, available at https://helpx.adobe.com/photoshop-elements/key-concepts/raster-vector.html. For examples of the vectorization of topographical maps, see K.-H. Lee, S.-B. Cho and Y.-C. Choy, “Automated Vectorization of Cartographic Maps by a Knowledge-Based System,” Engineering Applications of Artificial Intelligence 13 (2000), 165-178; S. Oka, A. Garb and K. Varghese, “Vectorization of Contour Lines from Scanned Topographic Maps,” Automation in Construction 22 (2012), 192-202. Foe examples of the vectorization of line drawings, see M. Bessmeltsev and J. Solomon, “Vectorization of Line Drawings Via Polyvector Fields,” ACM Transactions on Graphics 38.1 (2019), 12 pages, available at https://doi.org.10.1145/3202661; L. Donati, S. Cesano and A. Prati, “A Complete Hand-Drawn Sketch Vectorization Framework,” Multimedia Tools and Applications 78 (2019), 19083-19113, available at https://doi.org/10.1007/s11042-019-7311-3.